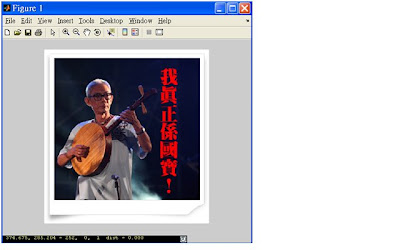
步驟:Import data→點選圖檔後開啟→Finish,
Workspace內就會有圖擋名稱,
將figure;imshow(圖檔名稱);pixval('on'); 就會有圖出現。
如下:
>> figure;imshow(x2835280748_ce0f36a482);pixval('on');
Warning: PIXVAL is obsolete.
IMPIXELINFO is its recommended replacement for pixel reporting.
IMDISTLINE is its recommended replacement for measuring distance.
> In pixval at 89
In pixval at 73
Warning: PIXVAL is obsolete.
IMPIXELINFO is its recommended replacement for pixel reporting.
IMDISTLINE is its recommended replacement for measuring distance.
> In pixval at 89
In C:\Program
Files\MATLAB\R2007a\toolbox\matlab\graph2d\scribeclearmode.p>scribeclearmode at 21
In uisuspend at 30
In uiclearmode at 101
In pixval at 147
In pixval at 73

>> x2835280748_ce0f36a482(100,200,1:3)
ans(:,:,1) =
22
ans(:,:,2) =
24
ans(:,:,3) =
45
P25中間…will return three values, but because g is a single two-dimensional matrix, all three values will be the same.(g=x2835280748_ce0f36a482 圖檔名)
這裡的return和all three values will be the same是什麼意思?
因為ans的答案並不相同。
>> impixel(x2835280748_ce0f36a482,100,200)
ans =
18 24 36
>> em=imread('emu.tif')
??? Error using ==> imread at 315File "emu.tif" does not exist.
打了這個指令,發生了錯誤,它說”emu.tif”不存在,那是什麼?
相較於第一章而言,實做部分豐富了整個第二章的內容,既使不用每行的原文書都懂,也可以了解大概的內容。
跟著課本的指令練習,甚至拿一些其他的值去試試,出來的結果會是不一樣的,而且指令打多了,很有成感!
沒有留言:
張貼留言