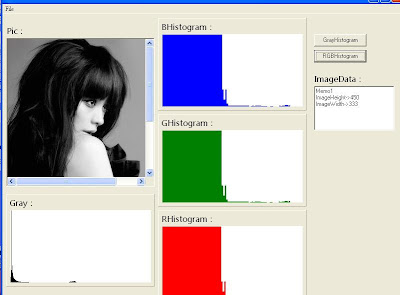
1.GrayHistogram
以ARect為範圍統計直方圖的程式碼:
Byte *ptr; long GrayCount[256] = {0}, MaxGrayCount = 0; for(int row = 0; row < ptr =" (Byte">Picture->Bitmap->ScanLine[row];
用8bit灰階圖為方法的程式碼:
for(int col = 0; col <> MaxGrayCount) MaxGrayCount = GrayCount[ptr[col]]; } }
初始化直方圖的畫面得程式碼:
Image5->Canvas->Brush->Color = clWhite; Image5->Canvas->FillRect(TRect(0, 0, Image1->Width, Image1->Height));
畫出直方圖畫面的程式碼,利用for迴圈:
for(int index = 0; index <>Canvas->MoveTo(index, Image2->Height); Image5->Canvas->LineTo(index, Image2->Height * (1.0 - (double)GrayCount[index] / (double)MaxGrayCount)); }
2 . RGBHistogram
以下都跟畫出GrayHistogram的方法相同~
用8bit灰階圖為方法的程式碼:
for(int col = 0; col <> MaxGrayCount) MaxGrayCount = GrayCount[ptr[col]]; } }
初始化直方圖的畫面得程式碼:
Image5->Canvas->Brush->Color = clWhite; Image5->Canvas->FillRect(TRect(0, 0, Image1->Width, Image1->Height));
畫出直方圖畫面的程式碼,利用for迴圈:
for(int index = 0; index <>Canvas->MoveTo(index, Image2->Height); Image5->Canvas->LineTo(index, Image2->Height * (1.0 - (double)GrayCount[index] / (double)MaxGrayCount)); }
RGB呈現:利用FOR迴圈將RGB 顯現..
for (int i=0;iHeight;i++) { ptr=(Byte *)bmp->ScanLine[i]; index=0; for (int j=0;jWidth;j++) { b=ptr[index]; g=ptr[index+1]; r=ptr[index+2]; RGBhistogram[0][b]++; RGBhistogram[1][g]++; RGBhistogram[2][r]++; index+=3; if(RGBhistogram[0][b] > MaxBCount) MaxBCount = RGBhistogram[0][b]; if(RGBhistogram[1][g] > MaxGCount) MaxGCount = RGBhistogram[1][g]; if(RGBhistogram[2][r] > MaxRCount) MaxRCount = RGBhistogram[2][r]; } }
心得:
這是作業三~ 我也重新看過程式碼 並且加上註解,就像是我們知道value的範圍是0~255,可以直接宣告一個256的陣列來統計,最後在畫線條的時,再去取得它的出現次數除以它的百分比.這次作業,做起來顯的卡卡的,可能是我還不熟析的關係,我很認真的再去研究了一次程式碼,加上了注解,希望老師可以給我加點分數...謝謝

沒有留言:
張貼留言